With the recent heat wave that enveloped western North America, including Alberta, I was prompted to look into how weather in Lethbridge has changed over the years.
So, I downloaded data from Environment and Climate Change Canada (which was quite the ordeal, but I might save that story for another day). It included temperature and precipitation information going back to February 1908.
Here’s what I found.

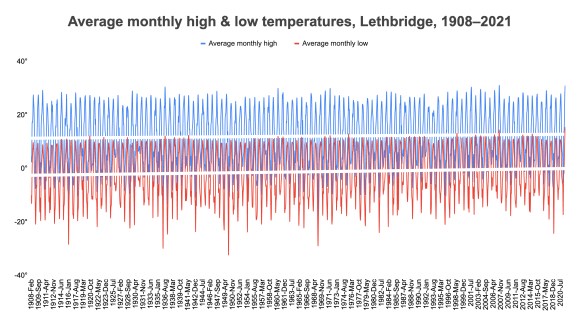
Here’s my first chart. It shows every high and low over the last 113 years in Lethbridge. It’s pretty busy, so it’s hard to see anything meaningful, but those two white lines running across the chart are trend lines. You might not be able to tell, but both of them trend upwards, but only slightly.
So, let’s do the average highs and lows for each month instead.

Like with the previous chart, the trendlines here also incline slightly. You can particularly see it among the average lows, which are much less likely to drop to the -20° range in recent years, compared to the early 19th century.
In this chart below of the annual average highs and lows, the trendline is much more pronounced, clearly showing an increase in both highs and lows—but particularly the lows—over the last 113 years.

The slope of the trendline for the highs is 0.0109. That means for every year you move to the right, the trendline increases by 0.0109°. So, after 10 years, it’s increased by 0.109°, and after 100 years, it’s increased by 1.09°, or 1.1° if we round up.
For the lows, the slope is almost double: 0.0203. After 100 years, the trendline for the average annual low temperature had increased by over 2°.
So, now that we know that the average annual highs and lows have been increasing, I wonder what the average temperature overall is.
The average daily temperature—or the mean temperature—is what you get when you take all the temperature readings in a day and average them out.
Here’s the average daily temperature since 1908.

The red line is the trendline, and it’s slope is much smaller, rising by 0.0000448° at a time. But remember, this is for days, and my reference period includes 41,413 days. So, when we multiply the slope by 41,413, we find that the trendline sloped upwards 1.86° during the 113 years covered in the graph.
Even with one temperature a day instead of two, that chart is still pretty busy, so let’s look at monthly average temperatures.

Once again, we see the trendline sloping upwards. This time, it’s more pronounced, with a slope of 0.00145 per month. At 1,361 months since February 1908, that gives us a trend of 1.97° over the last 112 years.
Finally, here are yearly annual temperatures

This one seems more pronounced than the other ones, but it’s probably because there are fewer data points. It’s slope is 0.053° per year, which gives us an increase of 1.73° to the trendline over the last 113 years.
Clearly, the temperature in Lethbridge has been increasing.
Here’s another way to look at: splitting the data into decades:
| 1908–1917 | 4.9° |
| 1918–1927 | 4.9° |
| 1928–1937 | 5.4° |
| 1938–1947 | 5.5° |
| 1948–1957 | 4.6° |
| 1958–1967 | 5.2° |
| 1968–1977 | 4.9° |
| 1978–1987 | 5.9° |
| 1988–1997 | 6.0° |
| 1998–2007 | 6.9° |
| 2008–2017 | 6.3° |
In the 100 years since 1908, the average temperature per decade increased from 4.9° in the first decade to 6.9° in the last, an increase of a full 2°. The most recent decade dropped slightly to 6.3°, which is still the second warmest decade of the period, but we’ll see how the current decade holds out. It’s been only 3 full years so far, but the average of those 3 years was 5.8°.
There’s one more thing I want to look at: precipitation.

Lethbridge obviously isn’t getting as much moisture as it used to. It looks like it’s been dropping since around the 1950s.
Here’s the what the average annual precipitation looks like when grouped by decade.

Yep, definitely less precipitation.
The most recent decade saw an average of 264.84 mm of precipitation, down from a high of 443.85 mm between 1948 and 1957. That’s a 40% drop.
No matter how you look at it, Lethbridge is getting hotter and drier.
For comparison, according to the US Environmental Protection Agency, since 1901, the global average surface temperature has risen at an average rate of 0.17° F (or 0.09° C) per decade. That’s about 0.9° C between 1901–2001, on average. Which seems to be a smaller increase than what Lethbridge has seen.


4 replies on “Lethbridge hotter and drier than 100 years ago”
[…] I wrote an article a few weeks ago showing that over the last 100 years, the weather in Lethbridge has become hotter and drier. And unless we do something about it, what we saw this past summer could become commonplace. […]
Just what do you propose to do? One hundred years is a small even miniscule period of time. Lets go back 700 years or even 2000 years and it will become clear that this is not the first or even second time this has happened.
Stop trying to create a problem where none exists.
I didn’t choose the timeframe. That’s as far back as Environment Canada’s data goes.
Here you go George, although not specific to Lethbridge, which didn’t even exist 2000 years ago. The issue is not so much that the world has cooled and warmed up in the past, but the speed with which it is warming up now, since the industrial age of the late 1800s.
https://assets.science.nasa.gov/content/dam/science/esd/eo/content-feature/globalwarming/images/proxy-based_temperature_reconstruction.png